Monday, 30 November 2015

Numerical, Algebraic, Graphical and Diagrammatic representations in the new KS3 maths

Recently we have been reviewing the KS3 programme of study in relation to the new KS3 National Curriculum and also how our KS3 programme relates to the changes in the KS2 curriculum to see whether we need to make changes due to overlap. In my perusal of the KS3 curriculum document this phrase jumped out at me:
  • move freely between different numerical, algebraic, graphical and diagrammatic representations
I must admit my immediate thought was 'ambitious' at least in terms of the "move freely" part; in my experience it is quite difficult to get pupils seeing different representations as representing the same thing. But then I thought how much fun it would be looking at all of the different representations at once and started thinking about how many I could come up with; here is my (not at all definitive) list:

  • Sequences: 1, 3, 5, 7, 9, 11, ....
  • Coordinates:  (1, 1), (2, 3), (3, 5), (4, 7), (5, 9), ...
  • Table of values  1     2      3       4      5
                                     1     3      5       7      9
  • Algebraic Sequence notation: Tn = 2n - 1
  • Line equation y = 2x - 1

  • One-dimensional diagrammatical representation:
  • Two-dimensional diagrammatical representation:


I definitely think it will be interesting to work with pupils and find ways of working with algebra in different representations - choosing a suitable representation for a problem and transferring from one representation to another as the need allows.

Sunday, 22 November 2015

Expanding and Factorising - Using areas to support understanding

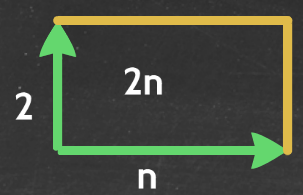
Recently I have been musing over the visualisation of algebra, and have been working with my pupils over viewing algebra as different dimensions. In particular the different visualisations that one can use to interpret algebraic multiplication. For example understanding that 2n can be be visualised like this:


or like this:


A lot of the work has therefore focused on when different visualisations (including 3 dimensions, and understanding if not drawing when we go beyond 3 dimensions) are useful, and when they lead to a more efficient approach for generalising approaches to multiplication. A really poignant example of this has been in expanding and factorising.

One of the first examples we explored was 5(2x + 3), and how this could be viewed like this:


or like this:


But that the first representation breaks down when expanding something like 2p(7p + 5), because we cannot create "2p" repeats. However the area representation still holds for this:


We were even able to explore how negatives could be handled with this representation, for example 5(2x - 4) being viewed like this:


With the logic here being that the blue shaded area is the area represented by 5(2x - 4), and that it is the whole area of 5 x 2x (=10x) subtract the 5 x 4 area (=20) and so we have 10x - 20 shaded.

An interesting example to explore was -6(2 - p), and see how to end up with -12 + 6p, for this we looked at this representation:

by thinking about what the negative of 6(2 - p) would look like (we did consider making the 6 point downwards, and showed that this can work as well as it would lead to -12 - (-6p), but the above was considered a more efficient representation).

What was really interesting was that having thoroughly explored this representation, how quickly the pupils took to factorising. To introduce factorisation all I did was put this image up on the screen and we talked about what would go next to each arrow:


Pupils all pretty much immediately saw the required lengths for the first two. The last one did lead to an interesting discussion about partial factorisation, and so I told the pupils that one of our aims is to maximise the shared height - this quickly led to this height being 3x. Even switching the positives for negatives didn't lead to difficulties as we were used to examining it as the difference of a large area and a smaller area:

I am beginning to think there is a real power in this representation to provide a consistent approach to visualising algebra, provided part of the work we do with pupils is showing them the different ways multiplication can be interpreted (as repeating a shape in the same dimension or extending into the next dimension). 

This week I will be tackling the expansion of two binomials and the factorisation of a quadratic into two binomials using a similar approach; I am really looking forward to seeing how that goes.

Monday, 16 November 2015

Why can't you simplify a + b?

Here we go, Year 7 bottom set teaching simplifying algebra, what does it mean to add together letters, or subtract letters. Why can't we write a + b as ab? Why is -2d + d equal to -d and not -3d? All of these are more I am trying to tackle. So we spent last lesson learning to translate "maths language" i.e.:

and completing activities around decoding expressions. This lesson then I started with this:

and got pupils to re-draw the picture so that all of the a arrows were together, and then the b arrows; invariably getting this picture:

We then moved on to this picture:

The interesting part of this of course being that some of the d's now move in the opposite direction, which cancel out d's above. We re-drew this to show that we don't actually need 4 d's.


We finished then with this:

which became this:

which was used to illustrate that we although it looks like we only need to go backwards, we cannot because we don't know how far backwards to go, so we have to go forward 2e before going backwards 5f.

I really like this representation of using lengths to represent variables, as it then generalises nicely into area when multiplying for example:

and then into other relationships between area and algebra.

The kids seem to be getting there with understanding, I think it will take them two or three more lessons before they are secure with approaching algebra like this, but I am convinced it will be worthwhile to start this process now in Year 7.

Sunday, 8 November 2015

Prime factorisation, indices and standard form - some great questions

As we all know by now (in England anyway) the new GCSE in maths is going to require pupils to make links between areas of maths, and challenge pupils to apply understanding in ways they might not have previously. In writing the new homework booklets for my department I have been challenging myself to ask questions in this vein, and have found a rich source in linking prime factorisations, indices and standard form. Now admittedly there are already related topics, however I think that I have developed some questions that challenge pupils understanding of these topics in ways that perhaps haven't been used as frequently before now. Here I am sharing a run-down of my top seemingly straightforward questions (in no particular order):

1) 108 = 22 × 33. 1082 = 11664. Find the prime factorisation of 11664.

2) 9216 = 210 × 32. Find the value of √9216.

3) Calculate (3 x 10⁴)3, giving your answer in standard form.

4) Find the prime factorisation of 6 x 10⁴, giving your answer in index form.

5) Find the prime factorisation of 3.2 x 10⁷, giving your answer in index form.

6) Find √(1.6 x 10⁵), giving your answer in standard form.

7) Calculate √(1/25), giving your answer in standard form.

8) Calculate (1.25 x 10⁸)(2/3), giving your answer in standard form.

These and more will be in my term 2 homework booklet for the pupils aiming at grades 7+ on the new GCSE, and I think are precisely the sort of skills that the new GCSE is aimed at ensuring pupils develop.


Monday, 2 November 2015

The missing link in Adding and Subtracting fractions

Ok, I hadn't realised it had been so long since I had blogged - I have been insanely busy writing homework booklets and test papers over half term so that has left little time for much else. One thing it did leave time for however was for me to make a nice mental leap in my teaching of adding and subtracting fractions.

As I explored in one of my more recent blog posts, the use of bar models for adding and subtracting fractions I felt really did help a number of my pupils see why fractions added and subtracted in the way they did. There was a minority though that still struggled, and at first I couldn't really see what else I could do - I couldn't think of a better way to explain the concept. Then (and I am not really sure how) I realised something crucial: these pupils didn't really understand the concept of equal area in fractions. The pupils couldn't see that a common denominator was necessary because they were thinking about how many parts each fraction had and didn't realise that the total area of the diagrams had to be the same for both fractions. Of course my earlier diagrams had been the same size, but I hadn't stressed it, believing it to be obvious. So the next time I introduced the topic of adding and subtracting fractions, I started with this picture:


Something so simple ended up being a watershed moment for me in teaching adding and subtracting fractions, because it forced pupils to see that quarters and thirds had to be turned into twelths (or a multiple of 12). We followed this up with this slide:


and this slide:


For those pupils that had continued to struggle, this was a revelation. They didn't need to break the picture up into 12, it already was! They had drawn it that way themselves, because the rectangles needed to be the same size. We could talk about why 8 square long rectangles, or 9 square long rectangles, wouldn't be useful, and everyone could see it. We came out with these pictures:


When I finally set this related challenge:

Everyone did it - 100% completion. Some within a minute. Most pegged 18 square long rectangles pretty much immediately, and only a few had an initial struggles about then representing 4/9 and 1/6 - but once we got past those they were there. In the end every book had a picture like this in:


and every pupil understood.

The full prezi can be found here, and it is definitely an approach I will be using again.