Probability without numbers

"There are n sweets in a bag. 6 of the sweets are orange. The rest of the sweets are yellow. Hannah takes at random a sweet from the bag. She eats the sweet. Hannah then takes at random another sweet from the bag. She eats the sweet. The probability that Hannah eats two orange sweets is ⅓.

(a) Show that n2 – n – 90 = 0

(b) Solve n2 – n – 90 = 0 to find the value of n."

Look familiar? This question caused massive controversy when it was released in summer 2015 as it was seen as too much like things to come - many felt that it was more like the sort of question we might expect in 2017 when the new '1-9' GCSE is first examined and had no place in the current GCSE. Whether you believe this or not, the point is clear that pupils need to understand the ideas of probability and apply them outside the realms of numerical chance. With that in mind I thought I would share some ideas about developing probability without giving (too many) values.

Probability and Proportion

I am surprised we do not see more links between probability and proportion as ultimately probability is a proportional idea, the chance of something happening is measured as a proportion of the things that are possible or as a proportion of a number of trials in an experiment. In the past proportionality has generally be pretty limited to calculating an expected number of trials that would satisfy the given condition. I think it is clear though that with anything up to 25% of the new GCSE paper content being linked to ratio and proportion I think that we will see a lot more questions linking these two topics in the future. Questions like the ones below could become much more common:

1) A packet of sweets has orange, blackcurrant, strawberry and lemon sweets in the ratio 4:3:2:1. James and Sarah both buy packets of the same number of sweets. James doesn't like strawberry and so gives all of his strawberry sweets to Sarah. Sarah gives James all of her lemon sweets in return. If James takes a sweet at random from his bag, work out the probability that James take a lemon sweet.

2) A childs' shape sorter has red, green, blue and yellow shapes. The number of red shapes is twice the number of green shapes. The number of blue shapes is twice the number of yellow shapes. In total the number of red and green shapes is twice the number total number of blue and yellow shapes. Work out the probability of a child selecting a red shape if the shape is taken at random.

To be fair it strikes me that a lot of ratio and proportion question can be adapted to give a probability question - question (1) above could just as easily be "write down the ratio" rather than "work out the probability" and there are lots of ratio and proportion questions out there that could be adapted to this vein.

Probability and Algebra

Hannah and her sweets have given us a pretty clear indication that this will be a rich source of links for examiners to mine and again it makes perfect sense: if you understand the ideas of probability and algebraic expressions/equations then there should be no reason why you cant apply the two ideas together. We have also seen in the SAMs at least one question that has purely algebraic expressions inside a Venn diagram linked to probability for pupils to work with and I am sure we will see more examples in the coming years.
1)

2) A bag of counters contains red, blue and green counters. There is one more red counter than green, and one more green counter than blue. Stefan takes a counter out of the bag and puts it on the table, followed by a second. The probability that Stefan takes a blue followed by a red is 1/9. Calculate the probability that Stefan takes two greens.

It strikes me that replacing lots of the numbers in current probability questions with letters will generate questions of this type, and so would be well worth some time in faculty meetings designing.

No doubt at this point people will be thinking "yes but probability and statistics will only be 15% or so of the content..." and of course they are right, but don't forget that 15% of 240 marks is a good 36 marks, so there is plenty of space for one of two questions of this type to creep in, particularly as they can also count towards the 20%  to 30% Algebra content or 25% to 20% Ratio content so I would suggest it is well worth building questions like this into your GCSE schemes.

Dimension and Pythagoras

My Year 10 have recently been working with Pythagoras in 3-D objects, and quite typically in my experience they were having difficulty identifying suitable triangles to calculate some of the lengths; particularly those lengths that go through a shape requiring multiple applications of Pythagoras. Being ready for this I decided to try an approach that I had been considering that links the number of applications of Pythagoras' Theorem to the number of dimensions that the line moves through. The approach met with some success and I can see how it might have real potential in linking to dimensional analysis so I thought I would outline it here.

The first and one of the key points was to ensure that pupils understood that Pythagoras' Theorem is a relationship concerning area. Although we often use Pythagoras' Theorem to solve for missing lengths, the actual essence of the relationship is between the areas of three squares where two of them meet to form a right angle. The image below is one that is typically used to illustrate this (and one I have used lots in the past).

Once my pupils understand that this is a relationship area, the discussion is then turned to dimensions. What I am hoping to show pupils is that the two shorter sides of a right triangle are lines that only move in one dimension, whereas the diagonal moves in two (as the two sides are at right angles they can be considered to be two independent dimensions). So Pythagoras' Theorem can be thought of as a relationship that starts with lines moving in a single dimension, and relates them to a line moving in two dimensions (linking to area being a two dimensional concept).

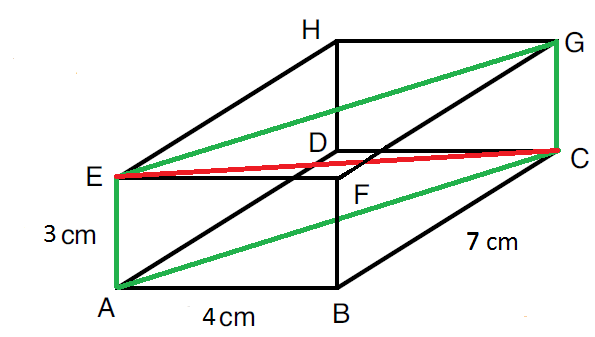
Now let us consider a cuboid like the one below:


An early job of work to do with pupils here is to make sure they can identify lines that move in one, two or three dimensions. Generally for me this leads to lots of gesturing around the room and drawing imaginary lines along walls and floors, as well as between corners across the room. Once pupils understand how these lines are moving we can start looking at which distance can be solved with only one application of Pythagoras' Theorem and which cannot. For example in the cuboid above the distances AF, BD, FC etc can all be solved directly using a single application of Pythagoras' Theorem as they are all lines that move in two dimension. 

Now let us consider a line that moves in three dimensions, for example EC. A tip from me on this, before drawing the triangle in the shape, try drawing the rectangle first (as below). For some reason pupils see this more easily that just the triangle.

The discussion we had here is that we cannot expect to solve for lengths like this with one application of Pythagoras, because this length moves in all three dimensions and Pythagoras' Theorem is a two dimensional relationship. In order to solve this problem we are going to need two applications of Pythagoras, one to relate two of the one-dimensional lines with a line that moves in two dimensions (in the above case either EG or AC will do the job) and then to use this line moving in two dimensions with the line moving in the third dimension to relate to the line moving in all three dimensions.

To some this might seem like overkill, but what it does is give pupils an objective test as to whether a line can be solved using given information - if it moves in more than two dimensions it cannot be solved by a single application of Pythagoras' Theorem using lines that only move in one dimension. Of course from here you can complicate things and look at other three dimensional shapes, begin to make judgements about whether line can be considered to move in only one dimension (right-angled to each other), two dimensions or three dimensions. I also think it reinforces area as a key concept and will provide a nice link to dimensional analysis of different formulae when it comes to looking at that concept in more depth.

So in the future I think I will definitely be talking about Pythagoras' Theorem as an area relationship, and definitely be talking about dimensions that lines move in more formally with pupils; if your pupils are having trouble applying Pythagoras' Theorem to three dimensions why not try it as well?

Proportion and straight line graphs

By now pretty much everyone involved in delivering the new Maths GCSE course in England are aware of the increased emphasis on pupils having proportional reasoning skills. Ratio, Proportion and rates of change as a separate strand of the GCSE is worth up to 25% of the assessed content of the qualification, and will appear linked with lots of other areas of maths. Already we are used to the idea of ratio and proportion appearing in trigonometry, scale diagrams, recipes, value for money, many different contexts; I want to look specifically at a couple of ways proportion appears in straight line graphs.

Most teachers of the new GCSE (and quite possibly old) will be familiar with the obvious relationship that proportion has with straight line graphs; namely the graph of two variables that vary directly with each other. Graphs of the form y = kx are a fairly straight-forward link between proportionality and straight line graphs.


In this graph, the y values and x values are proportional, with the ratio x:y being 3:5. This kind of proportion should be relatively straight forward for any pupil that really understands proportion as an idea, and for those more graphically minded may even help with being able to visualise proportion. So what about this graph:
Clearly this is not a 'proportion' graph in the sense that y and x are not in proportion to each other. However if we take a closer look...

Clearly there is a proportion going on here, but what is it? Of course in this case it is not the variables that are in proportion; rather it is the rates of changes in the variables that are in proportion. Specifically in this case that the change in y is half of the change in x (leading of course to the gradient of ½). 

This proportionality is often overlooked, or at least not made explicit, but given that rates of change is now part of the new GCSE I think it will be worth highlighting the idea of a straight line as a line where the rate of change of y is proportional to the rate of change of x and that this proportionality is where we get the concept of gradient. This may well help pupils when it comes to rates of changes of curves by applying tangents; if pupils are already familiar with the idea of gradient at rate of change because it has been made explicit when working with straight lines the the concept should come more readily when moving on to rates of change of curves.

So in order to ensure your pupils are ready for rates of change at GCSE, consider introducing them not just to graphs where the variables are in proportion, but also where the rate of change of one variable with respect to another is proportion: for if pupils can gain a deep understanding of how gradient links to proportionality then the beginnings of calculus are well within their grasp.

Introducing surds - cutting out squares...

The 'recent' changes to the KS3 curriculum suggest that we should be given our pupils a basic understanding of surds and surd calculation prior to GCSE. Some people may be wondering about how to introduce the idea of surds to KS3 pupils and so I thought I would share one of the things I do with pupils, and that is to look at drawing and possibly cutting out squares.


Typically this will start with some nice big squares. I actually quite like using inch-long squares; not because I have a real hankering to return to pre-decimalisation (I am too young to remember anything other than pounds and pence anyway!) but because I find centimetre squares too small and fiddly for this sort of work, and anyway I think there is something nice about reinforcing the concept of area by looking beyond the normal cm or metre squares. You can't buy inch square paper these days (or if you can I don't know where you can) but you can download square grids from the internet and stretch the image so that each square is 2.5 cm long. I need plenty of this paper as kids will need lots of attempts to try and fail; kids get to fail a lot here, so if you are looking to examine mindset as well this is a great activity to try.

I will start kids off by getting the to draw a square with 25 inch-squares inside, which most will do quite quickly. Next I will tell them to draw a square with 16 inch-squares inside of their 25 inch square so that they have this smaller square inside the larger square. The next part will be a discussion about what we might be able to say about squares with areas between 16 and 25 inch-squares, with the aim that pupils will realise that any square with an area between these two will have to have sides between 4 and 5 and therefore will be (a) drawable between the two squares we have already drawn and (b) have area made up part squares. Then comes the challenge (which at first to some pupils doesn't appear as much of a challenge): draw me the square that has an area equivalent to precisely 20 inch squares. Depending on the group this will proceed in one of two ways; either they will draw an attempt between the two squares they previously drew, bring it to me to measure (I keep a ruler that measures inches for this and other purposes), and then become frustrated when I show them that their area cannot be quite 20 inch-squares or alternatively (which I prefer) I will get them to draw a 4 x 5 rectangle and then cut their square up and see whether it can completely cover the rectangle (prompting to leave the 4x4 square intact and just cut the excess from around it and try and make it fit if necessary). This second approach is definitely nicer provided the pupils have the resilience to keep re-drawing the squares every time they make a mistake: of course sometimes because of small gaps between their pieces they will think they have completely covered the rectangle and you will have to show them (either by measuring the hole they cut or by talking about very small gaps etc) that they haven't got to exactly 20.

The purpose of the activity of course is to plant the idea in pupils head that the task may be impossible to perform in reality. I will often talk about accuracy of measuring instruments here as well, and get pupils to imagine rulers that could measure down to a millionth of an inch or more. What this allows me to do is introduce the idea of an irrational number in a way that speaks to pupils experience; they have seen first hand that the square root of 20 cannot be found as a decimal or fraction of the length of a real square. I can then talk about the fact that mathematically the number needs representing exactly rather than as a rounded value, and so the surd form is required, which leads to the need to be able to calculate with numbers in this form and so on. For me this approach is much more powerful than a simple calculator investigation and not just because it is more engaging for kids than just mindlessly punching numbers into a machine, but also because it really highlights the reality of irrational numbers: these are numbers that cannot be measured and cannot be represented in ways that have been used before.

So if you are looking for a nice concrete way to introduce the idea of surds that gives (for me) real insight into the fundamental nature of these type of numbers, then try getting your kids just drawing and cutting out squares.


Mode - Most unappreciated?

For me, the mode is one of the most unappreciated averages that we teach in maths education. Perhaps because of its simplicity, perhaps because sometimes we feel it can contradict the idea of 'centralcy' that we look for in a good average, or perhaps because it isn't often talked about formally in many everyday situations, but rarely does mode get significant lesson time beyond its introduction in primary school. Often it is paired with median in a unit which then devotes a whole lesson or more to mean calculations; occasionally it is lumped into a general 'averages' lesson and becomes almost a footnote when looking at lists of numbers to get pupils to look at the list ready to find median and mean. In my opinion this is a real shame as the mode can be one of the most versatile and available averages, so I thought I would share with you some things that I like to do with the mode...

1) Mode from different representations

I love introducing the idea of mode as the most frequent item of data, and then challenging pupils to identify it in lots of different representations, such as bar charts, pie charts, tally charts, bar line graphs etc - recently I gave pupils a sheet with these images on and challenged them to find the mode from each situation: 


We got a load of misconceptions out of the way here; a mode of 4 or a mode of 7 from the frequency table, a mode of 6 from the bar line chart, what happens when 241 and 242 appear the same number of times; stimulated a lot of discussion and conflict and led to some real understanding.

2) Make up a list of data.

A nice pre-cursor to more complicated problem solving is to just give pupils a mode and to ask pupils to come up with different lists of numbers that satisfy the conditions. As a simple example, the question might well be something like "4 numbers have a mode of 3, Give a possible list of the 4 numbers." This can then be complicated in the following ways:
  • 4 numbers have a mode of 3. What is the maximum number of 3s in the list? What is the minimum number of 3s?
  • 4 positive whole numbers have a mode of 3. All of the numbers are 3 or less. Write all of the possible lists of numbers.
  • 4 positive whole numbers have a mode of 3. The numbers add up to 10. Write down the four numbers.
  • 4 positive whole numbers have a mode of 3. What is the minimum total that the four numbers can have? What about the maximum total if all of the numbers are less than or equal to 3? Less than or equal to 5?
amongst other similar examples.

These sorts of questions are nice to get pupils thinking and reasoning with mode; it is lovely to see them reason that the third list cannot have two 3s or realising that the fourth list cannot sum to 8.


3) Modal mystery

Similar to above, designed to promote reasoning around the mode, these sorts of questions are lots of fun to throw at kids:

                                     2           .............         1         ..................          3

The above list of 5 numbers has 2 values missing. What could the mode be? What could it be if 3 is the highest number? If 1 is the lowest number? What about if we change the 3 to a 1? 

4) Real life modes

Although rarely referred to formally as mode, a lot of statistics encountered in real life boil down to a mode. Whether it is votes on a popular TV reality show (X Factor, Strictly come Dancing, I am a Celebrity et al...) or likes on Instagram, giving a couple of examples like this and asking for more from pupils personal experience is a lovely thing to do with mode, because once you start to think about it, you can come up with loads!

So please, when you are teaching averages, don't just skip over the mode; there is so much more to come from this most common of measures.